|
Task:
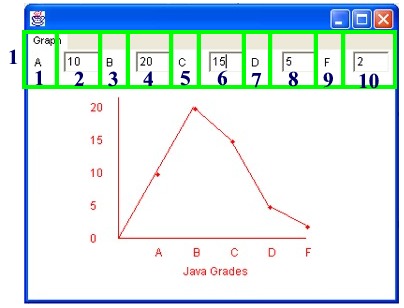
Display a line graph representing the number of A's, B's, C's, D's and F's on the
Java Programming Final Examination.
1.
Decide how the window will look. We need 5 labeled areas to
receive user input.
Label LabelA = addLabel("A", 1,1,1,1);
IntegerField FieldA = addIntegerField(0,1,2,1,1);
Divide the top of the window into the Labeled areas
and the Field areas for the user input.
| 2. The
word GRAPH is going to appear on the left side of the window such
that when clicked will |
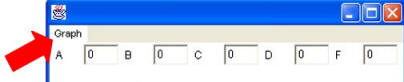 |
display a menu of choices. Right now, our only choice
will be Line (for Line Graph).
MenuItem lineChoice = addMenuItem("Graph", "Line");
|
3. Decide
upon the coordinates of the placement of the graph in the window.
We will need the
x-coordinate of the left side and the right side, as well as the
y-coordinate of the top and the bottom of our grid.
4. Establish a "constructor" to set the initial values in the program.
See the example demo.
|
A
constructor is a special type of method that creates
a new object. It has the same name as its class
and has no return value. The basic function of a
method is to execute code, while the only purpose of a
constructor is to create an instance of a class. |
5. Use the paint method to draw the graph.
6. Draw the graph such that:
-
the
letter grades are placed along the x-axis
-
the
frequency numbers are placed along the y-axis
-
a dot is drawn at
each grade value
-
the dots are connected
to form a line graph
Notes:
•
Methods will be
used for procedures that will eventually be shared by
all three graphing options - line graph, bar graph, and
pie graph.
•
The y-scale values can not exceed
the number of pixels used to create the y-axis.
|