|
Graphing Inequalities
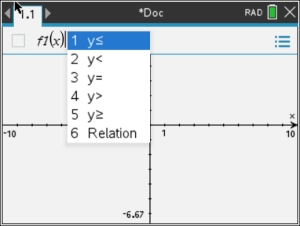
Graphing inequalities involves changing the "y = " entry to inequality symbols, <, >, <, >.
under the Graph option.
Since inequalities are "relations", instead of "functions",
this page will show how the enter "relations".
|
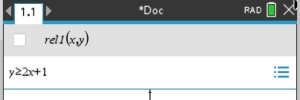
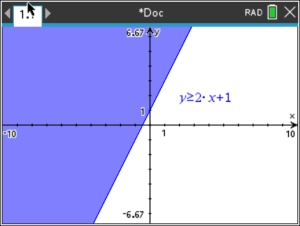
Example 1: Graph 
|
|

|
How to control the display of the graph:
To change line thickness of lines:
•  #1 Action, #4 Attributes #1 Action, #4 Attributes 
• scroll onto the line, to activate the line.
Press
(a vertical listing of three small boxes will appear)
•
The first of the boxes controls line thickness.
From the first box, arrow right or left to control the
thickness: "thin", "medium", "thick".
• After your choice, hit .
To change color (line and shade fill):
• #1 Action, #5 Set Conditions
• scroll onto the line, to activate the line.
Press
• drop-down box "Conditional Attributes" appears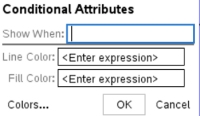
• click on the word "Colors" at the bottom of the box
to see the color choices.
Clicking on the color will NOT load the color into the graph. You must TYPE the NUMBER into the box shown above.
You can choose a color for the line and for the shading.
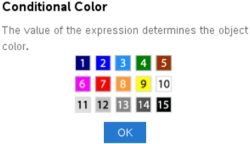
Choose the color numbers. Type the number under
"Line Color:" for the parabola
"Fill Color:" for the shading
OK
• After your choices, hit |
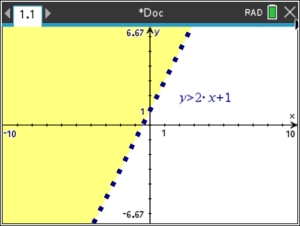
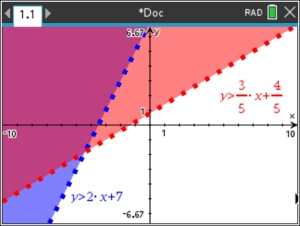
The graph has been changed
to strictly "greater than".
The dashed line is displayed in a "thick" setting, and in a color not the same as the shading color.

If you choose the SAME color for the line and the shading, you may not be seeing the line as a dashed line.
It may be that the thickness level of the dashed line is set at "thin" and it is blending in with the shading. You can either change the color of the line, or change the thickness of the line, to get the desired result. |
|
|
Example 2: Graph 
- Move to the right of f1(x) =.
- Hit
 . .
- Choose the needed inequality symbol.
- Type in -3x - 3
|
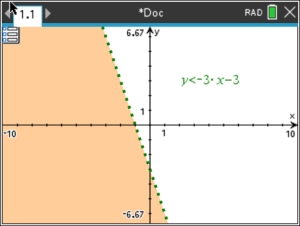 COLORING: Line 4 - green
Shading 8 - orange
|
|
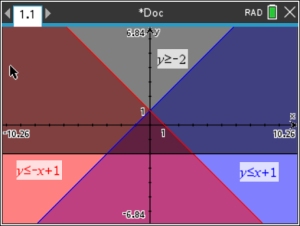
Example 3: Solve the system: 
-
You will need to isolate the y variable in the second equation so that it can be entered into the calculator.
Solving algebraically, (be careful of the direction of the inequality symbol in this problem.)
- The answer is the double shaded region (dark pink)
on the graph.
|
|
NOTE: If you previously used a TI-84+ CE graphing calculator, you know that it had a special feature that could shade only the solution area for a system of inequalities. It was listed under the title "Inequal Intersection". Unfortunately, the
TI-Nspire CX II non-CAS does not offer such a build-in "intersection" feature. But, fortunately, the system graphs clearly show the intersection area.
|
|
Example 4:
Solve: 
- Enter all three equations.
- Answer is the overlapped shading.
(The small triangle near the center.)
|
|
|