Basic Graphing
Both Classic Mode and MathPrint Mode
Basic Graphing
Both Classic Mode and MathPrint Mode
|
1. Enter equations
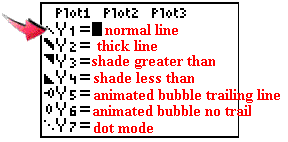
into "Y =" area. (Be sure the PLOTS
at the top of window are turned off.) When the =
sign is highlighted, the graph will be displayed. |
If the Plots at the top are
highlighted, move to them and hit ENTER to
deselect. |
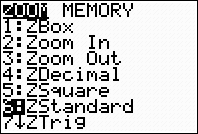
| 2. Choose the viewing window. The ZOOM key will let you chose various pre-set
windows. The most common choice is #6
ZStandard which gives a [-10,10] by [-10,10] window. Note: This window may be simply referred to as a 10 x 10 window, implying 10 units in all directions. |
|
|
|
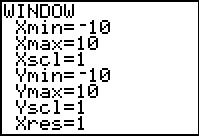
If you prefer, you can control your own viewing window by choosing WINDOW. The window shown above was the result of choosing #6 ZStandard.
|
||
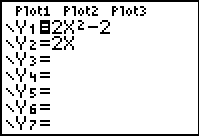
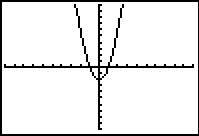
| 3. Hit GRAPH to see your graphs. Notice that
the second graph, y = 2x, did not graph. To see the graph, the = sign must be highlighted. |
|
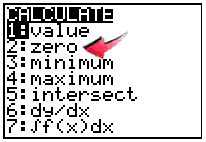
| 4. If you need to find
the roots of the equation (the x-intercepts) you may choose
#2 ZERO from the
CALCULATE menu under CALC (above the
TRACE key). The calculator will prompt
you for responses. If you need to find points of intersection between two graphs, you may choose #5 INTERSECT from this same menu. |
|
|
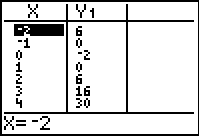
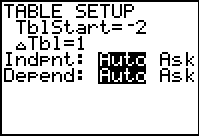
5. If you need to see
values
relating to the graph, go to the TABLE (2nd GRAPH).
You can control what you see in the table by going to TBLSET (2nd WINDOW). |
 |
![]()
Finding Your Way Around
TABLE of CONTENTS