 |
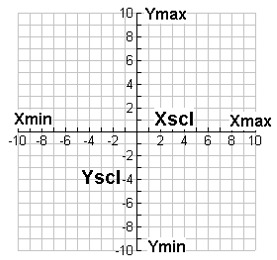
The size of the coordinate
plane is defined by Xmin, Xmax,
Ymin, and Ymax,
as seen at the left.
• Xmin
must be less than Xmax
• Ymin must be less than
Ymax
• Xscl and
Yscl define the distance between tick marks on the x-axis and y-axis
• To turn off tick marks, let Xscl = 0 and
Yscl = 0
• 3/2 aspect ratio in window |

|
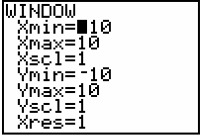
Xres sets pixel resolution 1 to 8.
The default is 1. At
Xres = 1,
functions are evaluated and graphed at each
pixel on the x-axis. At
Xres = 8, at
every eighth pixel along the x-axis. |
|
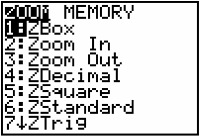
Zoom - Zoom - Zoom

 |
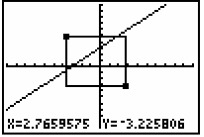
#1 ZBox - draws a box to define the new smaller viewing window.
Move cursor to upper left corner of where your box will be
placed. Hit ENTER to anchor that corner. Move cursor to lower
right corner of the desired box, press ENTER. The box will
fill the screen. |
 |
| #2 Zoom In - magnifies the part of
the graph surrounding the cursor location.
Move cursor to the location you wish to magnify and
hit ENTER.
To magnify a second time, hit ENTER again. You can move the
cursor between zooms and continue magnifying.
To return to previous graph, chooose
#3 Zoom Out
and press ENTER. To
quickly return to the 10 x 10 screen, press #6 Zstandard. |
#4 ZDecimal - plots the function with values
Xmin = -4.7,
Xmax = 4.7,
Ymin = - 3.1,
Ymax = 3.1. The  X
and X
and  Y
are 0.1. In plain English, you have a smaller
screen which traces nicely in increments of
one decimal place. Y
are 0.1. In plain English, you have a smaller
screen which traces nicely in increments of
one decimal place. |
#5 ZSquare -  X
= X
=  Y.
The aspect ratio is adjusted so that circles will
look like circles. The domain in the window is
-15 to 15 and the range is -10 to 10. Y.
The aspect ratio is adjusted so that circles will
look like circles. The domain in the window is
-15 to 15 and the range is -10 to 10. |
| #6 Zstandard - 10 x 10 window.
This window is usually large enough to show a
representative portion of a graph. Remember,
however, that the graph is slightly distorted
because the x and y units are not equal. |
#7 Ztrig - window appropriate for trig
graphs. In Radian Mode,
the domain is  ,
the range is -4 to 4, and Xscl
= ,
the range is -4 to 4, and Xscl
=  .
In Degree Mode,
the domain is -352.5° to 352.5°, the range is -4 to
4, and Xscl = 90°. .
In Degree Mode,
the domain is -352.5° to 352.5°, the range is -4 to
4, and Xscl = 90°. |
#8 ZInteger -
 X
= X
=  Y
= 1. Xscl,
Yscl = 10. Each
pixel represents one unit along the horizontal and
vertical axes. Move cursor to desired center,
ENTER. Y
= 1. Xscl,
Yscl = 10. Each
pixel represents one unit along the horizontal and
vertical axes. Move cursor to desired center,
ENTER. |
| #9 ZStat - redefines window to
appropriate size for statistical plotting.
Automatically adjusts the window to show all data
points in the active plot in STATPLOT. |
| #10 ZFit
- recalculates Ymin and
Ymax using
current x-values to show best graph. The range
is adjusted so that the function will enter the
window at a corner on the left side. If the
function is odd, it will leave the window at the
other corner of the diagonal. If the function
is even, the range will cover the extreme y-value in
the other direction of the entry point. |
|
|


![]()