Mean, Mode, Median with Grouped Data
Mean, Mode, Median with Grouped Data
Find the mean, median and mode for this grouped data of test scores.
|
|
This problem could be solved by entering ALL 35 scores into one list, with the score 65 appearing twice, 70 appearing 3 times, and so on. But if we deal with the data as we deal with a frequency histogram, we can accomplish our task more quickly. |
|
|
Enter the scores into L1 and the frequencies into L2. |
|
| Find the Mean and Median: | |
|
Method 1: (fast and easy) Press 2nd MODE (QUIT) to return to the home screen. Press 2nd STAT (LIST). Arrow to the right to MATH. Choose option #3: mean( if you want the mean. Choose option #4: median( if you want the median. Your choice will appear on the home screen waiting for you to tell it which list to use. This time we will tell the calculator the list containing the scores AND the list containing the frequencies. Notice the comma separating the lists. Remember the List names appear on the face of the calculator above the number keys 1-6. |
|
|
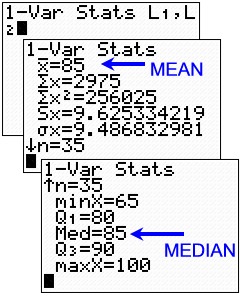
Find the Mean and Median: When 1-Var Stats appears on the home
screen, tell the calculator the name of the
list containing the scores AND the name of the list containing the
frequency
Arrow up and down the screen to see the statistical information about the data. |
|
|
|
|
![]()
Finding Your Way Around
TABLE of CONTENTS