MathBits.com Table of Contents logo

Changes in Statistical Information
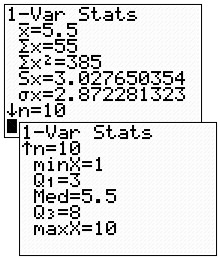
What effect does changing the data have upon statistical information?
Let's examine a few situations with the aid of the graphing calculator.

Situation 1:  If all of the data in a set were multiplied by 8, by what factor would the variance of the data change?

1
Create a simple test situation.  Pick 5 or 10 pieces of data at random and enter them in a list.
{1, 2, 3, 4, 5, 6, 7, 8, 9, 10}


2
Calculate 1-Var Stats to obtain the population standard deviation.

3
Compute the
variance.

4
Multiply the data times 8.

5
Re-calculate the 1-Var Stats
for the new list.

6
Re-calculate the variance.

Now, compare the two variances to ascertain what is happening
when the data is multiplied by a factor of 8.
We notice that 8.25 x 64 = 528

The variance is multiplied by a factor of 64,
when the data is multiplied by a factor of 8.


Situation 2:  If all of the data in a set is tripled, which, if any, of the summary statistics are also tripled?

7
Create a simple test situation. 
{1, 2, 3, 4, 5, 6, 7, 8, 9, 10}
Create a second list with the data tripled.


8
Calculate 1-Var Stats on the original data.

9
Calculate 1-Var Stats on the
tripled data.

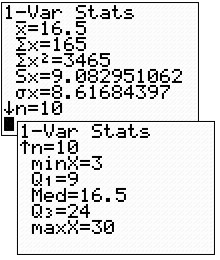
Now, compare the findings.  From examining the calculations, we know that the mean, the standard deviation (both sample and population), the minimum, the first quartile, the median, the third quartile and the maximum are also tripled.


In both of these examples, the 1- Var Stats allowed us to quickly examine the data to see what was happening when the data was rescaled.


divider
Finding Your Way Around TABLE of  CONTENTS