|
Correlation Coefficient
How well
does your regression equation truly represent
your set of data?
One of the ways to determine the answer to this question is to
exam the correlation coefficient and the coefficient of
determination.
|
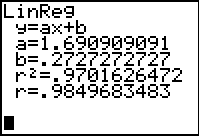 |
The correlation
coefficient, r, and the coefficient of determination, r 2 , will appear on the screen that shows the regression
equation information
(be sure the Diagnostics are turned on ---
2nd Catalog (above
0), arrow down to
DiagnosticOn, press
ENTER twice.) |
|
In addition to
appearing with the regression information, the values r and r 2 can be found under
VARS, #5 Statistics
→ EQ
#7 r and #8 r 2 . |
|
Correlation Coefficient, r : |
 The quantity r, called the linear correlation coefficient,
measures the strength and The quantity r, called the linear correlation coefficient,
measures the strength and
the direction of a linear relationship
between two variables. The linear correlation
coefficient is sometimes
referred to as the Pearson product moment correlation coefficient
in
honor of its developer Karl Pearson.
The mathematical formula for computing r is:
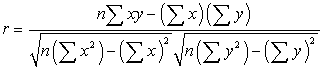
where n is the number of pairs of data.
(Aren't you glad you have a
graphing calculator that computes this formula?)
The value of r is such that -1 < r < +1. The + and – signs
are used for positive
linear correlations and negative linear
correlations, respectively.
Positive correlation: If x and y have a strong positive linear correlation, r is close
to +1. An r value of exactly +1 indicates a
perfect positive fit. Positive values
indicate a relationship between x and y variables such that as
values for x increases,
values for y also
increase.
Negative correlation:
If x and y have a strong negative linear correlation, r is close
to -1. An r value of exactly -1 indicates a perfect negative fit. Negative values
indicate a relationship between x and y such that as values for x increase,
values
for y decrease.
No correlation:
If there is no linear correlation or a weak linear correlation, r is
close to 0. A value near zero means that there is a random, nonlinear
relationship
between the two variables
Note that r is a dimensionless quantity;
that is, it does not depend on the units
employed.
A perfect correlation of ± 1 occurs only when the data points all lie exactly
on a
straight line. If r = +1, the slope of
this line is positive. If r = -1, the slope of this
line is negative.
A correlation greater than 0.8
is generally
described as strong, whereas a
correlation
less than 0.5 is generally described as weak. These values can vary based
upon the
"type" of data being examined. A study utilizing
scientific data may require a stronger
correlation than a study using social science
data.
| Coefficient of Determination, r 2
or R2 : |
The coefficient of
determination, r 2, is useful because it gives the proportion of
the
variance (fluctuation) of one variable that is predictable from the
other variable.
It is a measure that allows us to determine how certain
one can be in making
predictions from a certain model/graph.
The coefficient of determination is the ratio of the explained
variation to the total
variation.
The coefficient of determination is such that 0 < r 2 < 1,
and denotes the strength
of the
linear association between x and y.
The coefficient of determination represents the percent of the data that is the closest
to the line
of best fit. For example, if r = 0.922, then r 2 = 0.850, which means that
85% of the total variation in y can be explained by the linear relationship between x
and y (as described by the regression equation). The
other 15% of the total variation
in y remains unexplained.
The coefficient of determination is a measure of how well the
regression line
represents the data. If the regression line
passes exactly through every point on the
scatter plot, it would be
able to explain all of the variation. The further the line is
away
from the points, the less it is able to explain. |