Return to Open Page for TI-89 Titanium
Return to Open Page for TI-89 Titanium
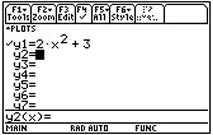
To get to the Y= screen, What is available from this Y= screen? |
F2 - ZOOM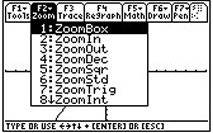 #6 Zoom Standard creates a 10 x 10 tick mark window. Remember that the aspect ratio of the standard window is not 1:1. TI-89 - 25:12 aspect ratio |
F3 - Edit selected function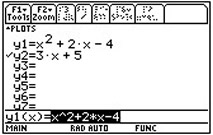 Also, you can simply arrow up onto the function and press ENTER to edit. |
|
| F4 Select or deselect function (√ mark shows to left of selected functions. Selected functions are the ones that get graphed ) |
F5 - All Functions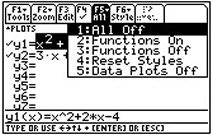 Turn ALL functions off or on quickly. |
F6 - Style of Graph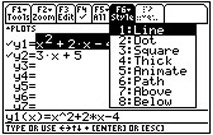 Change the style of the graph - dotted line, thicker line animated bubble, etc. |
|
Use GREEN DIAMOND to execute the window option. | TI-89 – WINDOW above
F2 |
Example: |
1. FROM the
GRAPH screen: |
Hit F3 - Trace. |
|
|
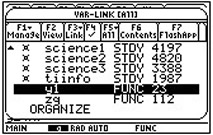
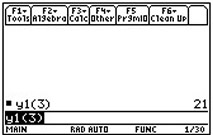
2. FROM the HOME
screen:
|
Engage VAR –
found above the subtraction key - to find the
Y1 variable. Arrow down on
that menu to find your function, Y1.
|
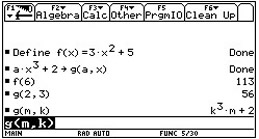
Now enter numeric value or variable.
|
|
||||||