Grab your TI-84+
graphing calculator!
|
|

You are becoming a calculator guru!
This is hidden Box #6!
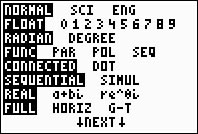
Before you begin: Be sure the calculator is set to default mode, as shown at the right. Hit the MODE key and be sure all entries are highlighted on the left. If not, use your arrow keys to move to the left and press ENTER to highlight, as you arrow down the screen.
Now, answer the following 6 questions. |
 |
Box 6 - Statistics and Probability Skills:
1. Data: 24, 26, 28, 23, 25, 32, 28, 40
Enter the data into the calculator lists. Press  , choose #1, enter data into the first column, L1. Go to the home screen. To find the median of the data, press, , choose #1, enter data into the first column, L1. Go to the home screen. To find the median of the data, press,  , arrow right to MATH, choose #4, , arrow right to MATH, choose #4,   . Which numbered choice is the median of this data? . Which numbered choice is the median of this data? |
| 1) 24 |
2) 25 |
3) 27 |
4) 28 |
For the next question, you need to clear L1. You can hit the  for every entry, or you can arrow up onto L1, press for every entry, or you can arrow up onto L1, press  , and arrow down. The list will be empty after you arrow down. Please clear L1. , and arrow down. The list will be empty after you arrow down. Please clear L1.
Also turn "off" or "clear" any entries in  . . |
3. Enter hours of study in L1: 6, 8, 10, 12, 9, 14, 16.
Enter test scores in L2: 65, 78, 80, 94, 85, 95,
98.
|
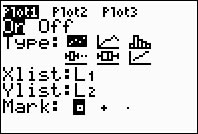
To prepare a scatter plot, press , choose #1,  , highlight the screen as shown. Press , highlight the screen as shown. Press  , #9. , #9. |
 |
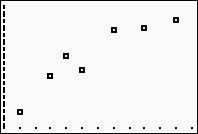
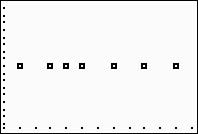
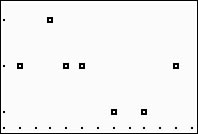
Which numbered graph is the scatter plot for this data? |
1) 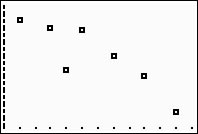 |
2)  |
3)  |
4)  |
| 4. To have the calculator find a line of best fit for the data in question 3, press , arrow right to CALC, #4. On the home screen enter L1, L2 after LinReg(ax+b), so you have LinReg(ax+b) L1, L2. Press . Which numbered choice is the linear equation for this data (rounding to nearest tenths)? |
| 1) y = 3.1x + 51.4 |
2) y = 51.4x + 3.1 |
| 3) y = 2.8x + 56.8 |
4) y = 56.8x + 2.8 |
5. In problem #4, typing
LinReg(ax+b) L1, L2, Y1 would automatically place the linear equation in Y1 making it available for graphing on top of the scatter plot. Which numbered choice will place Y1 (referencing the graphing equation location of the calculator) on the screen? |
1)  , arrow right to NUM, , arrow right to NUM,  |
2) , ,  , , , , |
3)  , arrow right to Y-VARS, , , arrow right to Y-VARS, , |
| 4) , , |
| For the next question, please clear L1 and L2. |
6. Enter this data in L1: 13, 3, 10, 9, 7, 10, 12, 8, 6, 3, 9, 6, 11, 5, 9, 10, 13, 8, 7, 7
Go to the STAT PLOT section:
|
|
, choose #1, , highlight the screen as shown above. We are now choosing the icon for a histogram under "Type". The Freq set to 1 means each piece of data will be counted once. Press , #9.
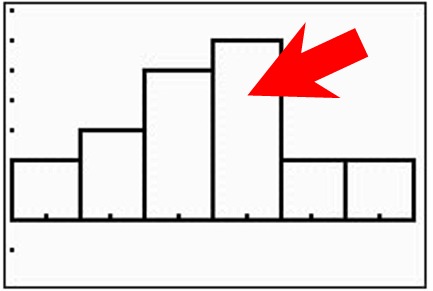
Press  and begin arrowing to the right. The letter "n", seen at the bottom, tells how many entries fall and begin arrowing to the right. The letter "n", seen at the bottom, tells how many entries fall
| within each section of the histogram. Which numbered choice represents the number of entries that fall within the 4th bar of the histogram? |
 |
|
| 1) 2 |
2) 3 |
3) 5 |
4) 6 |
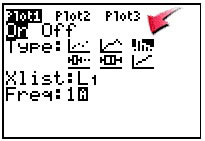
After working with a scatter plot, the plot setting remains "on". You can see this at by the highlighted Plot1 (see picture at right).
|
 |
To quickly turn "off" Plot1 from , arrow up onto Plot1, hit , and arrow down.
Please turn "off" Plot1. |
|
Read carefully!!
Find the sum of the answers times 84 squared.
Place this answer in the address below (following the capital letters "GC"), and type the address into your browser to find the next hidden box.
http://mathbits.com/caching/GC__________.html
|