|
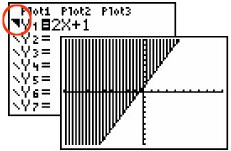
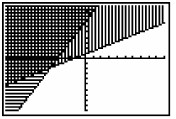
Example 1: Graph 
- Enter 2x + 1 into
Y1
- Arrow to the far left side
of Y1
- Hit ENTER until the
"shade above"
symbol
is displayed.
- Hit ZOOM #6 ZStandard (for a 10x10 window)
-
Graph
-
NOTE: You will have to
determine whether to draw a
solid line or a dotted line for y = 2x + 1.
This problem uses a solid line because of the "less than or
equal to" sign. The calculator
will display a solid line at all times.
(The Application program called
"Inequalities" will display solid and dotted
lines on the graphs.)
|
 |
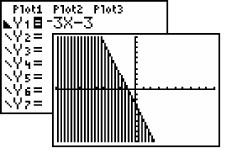
Example 2:
Graph 
- Notice the "shade below" symbol to the
far left of
the Y1.
- Again, you must determine whether to draw a solid
or dotted line. This problem uses a dotted line because it is
strictly "less than" (no "equal to").
|
 |
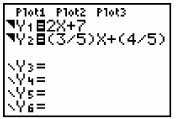
Example 3: Solve
the system: 
- You will need to isolate the y variable in
the second equation so that it can be
entered into the calculator with the "shade above" indicated.
Solving algebraically,
(be careful of the direction of the inequality symbol in this
problem.)
|
|
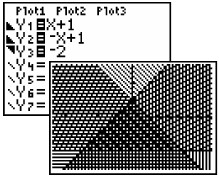
Example 4:
Solve

- Enter all three equations with appropriate "shade
above" or "shade below" symbol.
- Answer is the darkest shading.
|
Zoom Decimal
view. |