|

|
Graphing Piecewise-Defined
Functions |
Piecewise-defined, or split definition, functions can be graphed on
the graphing calculator.
You will need to utilize the relational
operators 
found
under the TEST menu (2nd
MATH).
The format for entering these
function can be either
(expression)/(condition) or (expression)*(condition)
where parentheses are essential in both situations.
Let's examine the differences between
the two methods,
see how to enter compound inequalities (2 < x < 6),
and
discover why these methods work.
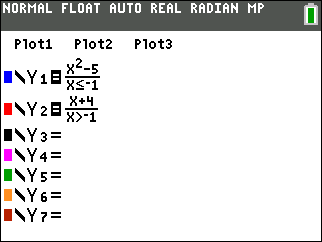
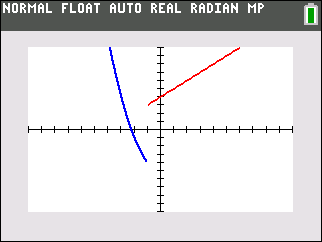
| Method 1:
(expression)/(condition) |
When using this method, enter
each SECTION of the function into a separate Y= area.
| Advantages of this method: |
Disadvantages: |
| 1. This method
of entering the function is helpful when trying to find any
mistakes as each section can be altered independently. |
1. When using TRACE, you will need to use your
up arrow to move between sections of the graph. |
| 2. The graph,
while still in CONNECTED MODE,
will not "connect" the separate sections together. The graph
will be a more realistic representation of the graph. |
|
| Method 2:
(expression)*(condition) |
When using this method, enter
each SECTION of the function into a separate Y= area
OR enter the ENTIRE function as one statement using + sign to separate
the sections.
|
The graphs from either of these entries will produce a connected graph.
Unfortunately, DOT MODE is needed with this method to see the actual piecewise functional shape. |

Connected MODE
|
DOT MODE
|
| Advantages of this method: |
Disadvantages: |
| 1. This method
allows for the function to be entered as one statement. When
using TRACE, there will be no
need to arrow up and down between sections of the graph. |
1. The graph,
while still in CONNECTED MODE, will "connect" the separate
sections together. This can lead to confusion about the
actual graph. |
| |
2. This method
requires a change to DOT MODE to get a realistic graph. |
| |
3. Entering the
function as one statement can be difficult to debug if an error
occurs. |
|
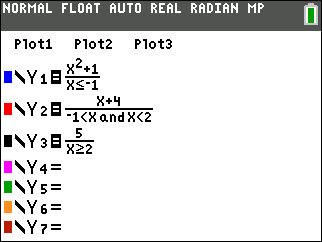
| Compound inequality: -1 < x < 2 |
|
|
|
|
Computers and calculators do not interpret
expressions such as -1 < x < 2 as we do in mathematics.
Both computers and calculators see this expression as ONLY
-1 < x (and they ignore the second part of the
condition). To force them to see the second condition, it
it necessary to write the expression:
(-1 < x < 2)
as
((-1 < x) and (x < 2))
(Find and from
the catalog or under TEST (2nd MATH) arrow right to LOGIC). |
|
|
 |
|
In Connected MODE |
 |
If you use the TI-84+C, you can use the "fraction template" for the "pretty print" display.
Parentheses are not needed with the template. The fraction template is under ALPHA - F1.
| So, what is really going on
here??? |
How is this process working?
The calculator is doing a Boolean check on these
conditions. Remember, Boolean equates a true condition to be a 1
and a false condition to be a 0.
Consider:  |
 |
When dealing with the division method, if a number is NOT
in the interval, x < 1, the condition is assigned a value of 0, and the
problem becomes division by zero. Since this is not possible, an
error is produced at those values and "nothing" is graphed in that area.
Since there is NO graph at these locations, there is also NO graphical connection
being made, even though the calculator is in Connected MODE.
|
 |
 |
Graph with axes turned off. |
|
When dealing with the multiplication method, if a number is NOT
in the interval, x < 1, the condition is assigned a value of 0, and the
problem becomes multiplication by zero. Of course the "graphing" of
this 0 value coincides with the x-axis and is not seen when the
axes are visible. Because this 0 value IS graphed, the Connected MODE kicks in, and the
sections of the graph are connected together.
|
|
|
 |
 |
Graph with axes turned off. |
|