Five Number Summary
Five Number Summary
The "five number summary", or five statistical summary", consists of
(1) the minimum, (2) the maximum, (3) the median, (4) the first quartile
and (5) the third quartile.
Find the "five number summary" for the data set
{85, 100, 97, 84, 73, 89, 73, 65, 50, 83, 79, 92, 78, 10}.
|
Method 1. A box and whisker plot will
clearly show a five number summary. See box-and-whiskers for information on creating these graphs. Pressing the TRACE key will display the values. |
|
|
| The whiskers extend from the minimum data point in the set to the first quartile, and from the third quartile to the maximum point. The box itself is defined by Q1, the median and Q3. The spider will jump from the minimum value to Q1, to median, to Q3 and to the maximum value. | ||
| Method 2. A complete five number summary is displayed on the lower portion of the 1-Var Stats screen. | ||
 Enter the data in a list. |
 Go to STAT - CALC and choose 1-Var Stats |
 On the HOME screen, when 1-Var Stats appears, type the list containing the data. |
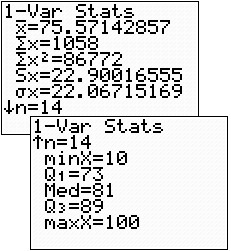 |
Hit ENTER. When the 1-Var Stats information appears, notice that there is an arrow pointing downward at the bottom of the screen. Arrow down. The five number summary is the listed as the last 5 items on this screen. |
|
![]()
Finding Your Way Around
TABLE of CONTENTS