|
A logarithm is an
exponent.
|
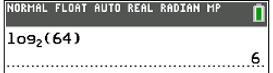
As this example shows, 3 is the
exponent to which the base 2 must be raised to create the answer of 8,
or 23 = 8. In general terms:
(where x > 0 and
b is a positive constant
not equal to 1) |
|
Entering logarithms on the graphing calculator.
Versions for both newer and older calculators
|
|
|
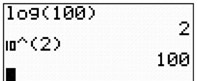
The log key will calculate common
(base 10) logarithms. |
 |
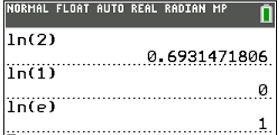
The ln key will calculate natural
(base e) logarithms. |
 |
|
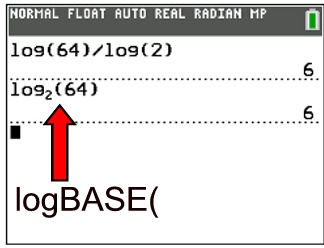
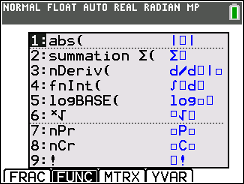
To enter other log bases :
• Use logBASE( template at MATH → arrow down to A:logBASE(.
For older calculator models:
• Use the following "change of base" conversion formula:

Example:
For log2 x. enter log(x) / log(2)
|
|
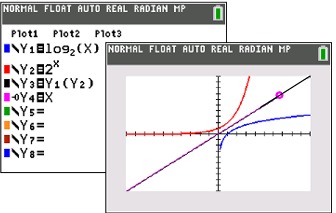
Beware of Graphs:
|
|
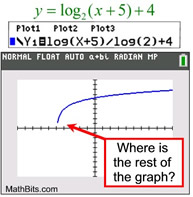
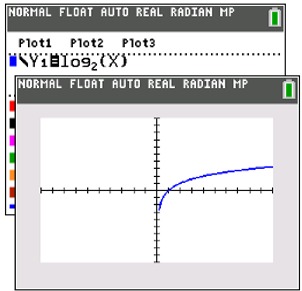
For TI-84+CE

Don't confuse log graphs
with square root graphs.
At fist glance, these two graphs appear to be similar. But the square root graph is actually ending, while the log graph is not. |
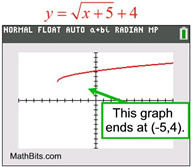 |
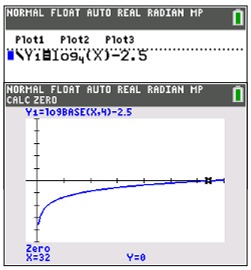
| On the logarithmic graph above, the calculator is "trying" to plot points on the graph to the left. But the graph is SO CLOSE to the asymptote of x = -5, there is no room to put additional pixels before it crosses over the asymptote. Plotting points "straight" down would violate the graph being a function, and the TI-84+ plots functions. The logarithmic graph continues downward toward negative infinity as it approaches the asymptote x = -5. |
Types of Logarithms:
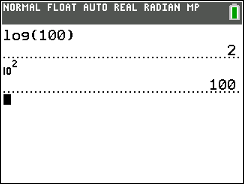
BASE 10: Logarithms with base 10 are called common logarithms.
When the base is not indicated, base 10 is implied.
The log key on the
graphing calculator will calculate the
common (or base 10) logarithm.
2nd log will calculate the antilogarithm or 10x
 |
|
|
OTHER BASES:
|
|
• You can also hit ALPHA (key), WINDOW
and choose
the fifth option on the menu, logBASE(.
|
|
|
BASE e:
Logarithms with base e are called natural logarithms.
Natural logarithms are denoted by ln.
On the graphing calculator, the base e logarithm is the ln key.
|
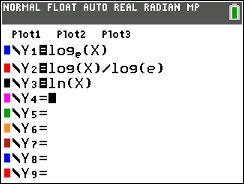
All three are the same. |
|
Note: If you are working with an older model of the TI-84+ calculator,
you may need to
use (and remember) the "Change of Base Formula"
for entering logarithms:
|
|
Also, remember that:
log x is with respect to base 10
ln x is with respect to base e |
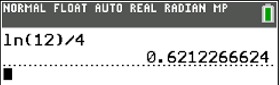
Examples:
|


 2.71828183


 is
is  .
.